
2% Inflation Is Not Normal
The 2% inflation target has been elevated to a status it does not deserve.

With the Fed Chairman doing a pivot at the Jackson Hole summit that indicates interest rate cuts are likely to be coming in the near term, some inflation hawks have raised the question of how the Fed can lower interest rates when they have not yet reached their 2% inflation target. It is worth noting that the Fed already lowered rates a full percentage point in 2024 prior to reaching their 2% target with inflation printing similar numbers as it is now. To be fair to those raising the question, the trend of inflation was moving lower then and has recently been moving higher at least partially as a result of tariffs. So while I do think there are valid questions to raise about lowering interest rates in the current environment, I would make that argument based on the recent inflation trend more so than on the current inflation level.
But the larger point about inflation being above target hangs on the sanctity of the 2% inflation target and reveals some general beliefs about that target which are simply unfounded. There are two basic tenants of that belief:
2% is a normal level of inflation that has historically been achievable and stable over meaningful periods that has been present during prosperous economic times.
2% is an optimal level for inflation that has been arrived at after careful economic and statistical analysis that shows it to be an essential target to maintain stable prices in the economy.
Unfortunately neither of these are true. Lets review each one individually.
Tenant 1: 2% inflation is normal
First lets examine what has historically been true of inflation in the United States over the past 65 years. Below is a chart of inflation from 1960-2020
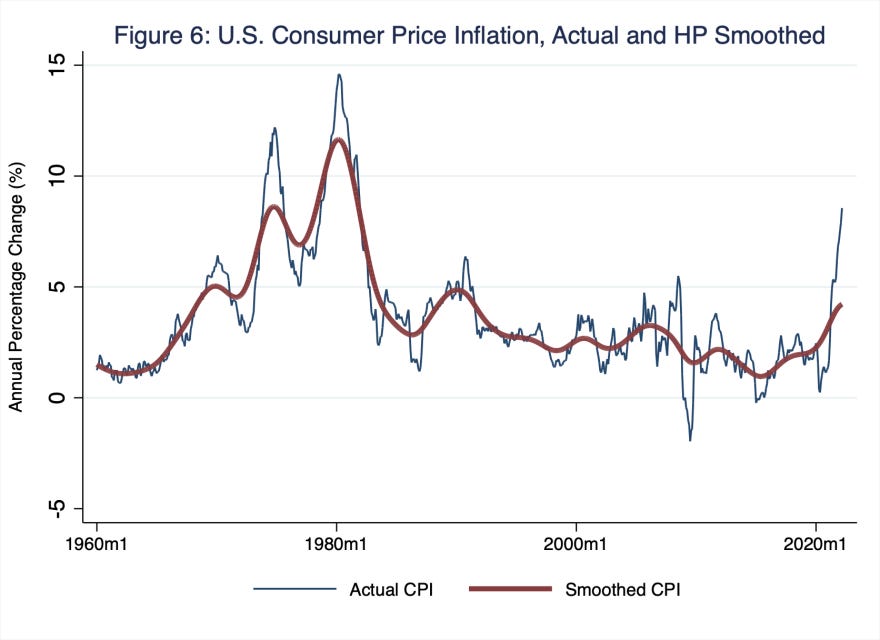
This shows the obvious spike in inflation in the 1970s that took a good portion of the 80s to address. Notice by the mid 1980’s the Fed’s high interest rate policy after causing 2 recessions had finally succeeded in getting inflation all the way down to almost 1%. However in a few short years by 1990 inflation was back to 6%.
Counter Point 1: There was nothing magical or stable about reaching the 2% level of inflation.
Now lets examine a more recent chart once we had entered a more sustainable low inflation environment in the 1990s.
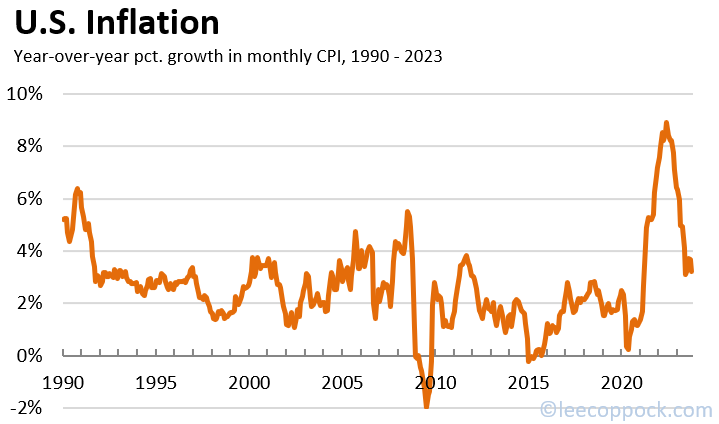
We start out this decade with that spike over 6% but then we quickly settled in to a low inflation environment. But notice the level that inflation mostly ran at for the entire decade of the 1990s and most of the 2000s? It ran at 3%. It bounced down below 2 a couple times but never stayed there for very long. In fact, for nearly 20 years until the Great Recession, 2% inflation was never maintained for longer than about 1 year and often times it jumped up closer to 4% or above.
Counter Point 2: 3% inflation has been a much more consistent level that we have been able to maintain during some very prosperous economic times. 2% was not normal, and 3% was not damaging.
But then notice what happened after the Great Recession. This is when the Fed did two things which have both continued to be debated as to whether they had been far too loose with monetary policy.
They dropped interest rates to zero percent and kept them there for about 7 years.
They vastly expanded the Fed balance sheet and engaged in a new policy of quantitative easing to purchase government and mortgage bonds for the purpose of driving market based bond interest rates down even lower since they could no longer lower the Fed Funds rate below zero.
The risk during this time was deflation not inflation. As we can see on the chart above, inflation actually went negative for a year to -2% in 2009. The actions of the Fed were designed to try to get us out of deflation towards a more normal level of inflation. They held to that monetary policy for nearly a decade and could only sometimes get inflation back to 2%. They succeeded in getting to 2% for a few years in the early 2010s and then inflation dropped back to zero once again. That was followed again by a few years of 2% inflation until the pandemic. The challenge during this entire time was not fighting inflation but fighting deflation.
Counter Point 3: The one and only period of sustained 2% inflation was achieved just in the last decade and only because the deflationary effects of the Great Recession continued to pull inflation down.
Summation: Over the past 35 years of a stable and low inflation environment prior to the pandemic, 3% was a much more common stable inflation level. We rarely maintained an inflation level near 2% for more than a year. It is only recently that 2% inflation has been achievable for multiple years, and that only occurred because of the depressing effects of a deflationary cycle that was started during the Great Recession. The pandemic reversed the deflationary cycle, and so now we are likely facing an environment much more similar to the 1990s and 2000s on the inflation front than the period in the 2010s. Using the recency bias of the 2010s deflationary reduced inflation levels as an anchor for what is possible and normal is misguided and a misapplication of a more complete data picture.
Tenant 2: 2% inflation is optimal and derived from data
There are two good summary articles on this point from a couple years ago:
From FiveThirtyEight: The Fed’s Inflation Goal Is Completely Arbitrary
From Time Magazine: The Fed’s 2% Inflation Target Is a Made Up Number
First lets review the 2% target around the world. Most central banks around the world have a 2% inflation target. The US was rather late to the party as they did not officially and publicly adopt the 2% target until as recently as 2012. However the Fed had been quietly using a 2% “goal” since about 1996. It is worth noting from the charts above that they never did hit that goal with any sustainability until the deflationary forces took over in 2009. It was much easier to announce an actual public 2% target rather than an unspoken 2% goal once deflation had drug the rate under 2%.
Since nearly all of the central banks have reached consensus on this 2% inflation target one might expect there would be some pretty strong statistical evidence behind that number. Unfortunately there is not, and the story of how all the central banks arrived at the number is both confounding and shocking for such a data driven group of bankers.
The history of the 2% target is really one of random choices by a single small country that then spread throughout the world. During the global inflation spike of the 1970s New Zealand’s central bank decided to create an inflation target to guide their efforts to control inflation. They were scrambling to try something to get inflation under control and came up with this idea of setting an inflation target. They had no data to base it on so they just had to pick a number. Initially they targeted a range of 0-2%. How did they pick that number? It was based on an offhand comment by the head of their central bank in an interview which he himself even called “almost a chance remark". Essentially the head of the central bank was caught unprepared by an interview question and simply pulled a number out of the air. As tends to happen with comments by leaders, it soon became policy and then spread around the world.
It’s been 50 years since that offhand comment so surely there has been plenty of time to do any necessary research to support the statistical basis for that number. No one has produced any such support. The number has simply become conventional wisdom but is really closer to folklore.
Summation: There is no statistical basis in research or data that indicates a 2% inflation target is optimal. It is an arbitrary target with no evidentiary basis.
If a 2% target has no basis in fact or data what should the Fed and other central banks around the world do instead? I would offer three suggestions.
They should abandon this notion of a sacrosanct 2% target. It is misleading and unnecessarily ties their hands to a paragon that is a mirage.
They should have a more open ended policy that targets a broader range of inflation which is more consistent with what happens in the real world.
They should put in the effort to do some research and statistical analysis on what types of factors they should be incorporating and targeting when they are trying to determine what level of inflation is the proper one to maintain price stability at any given time in a dynamic and evolving economy. The economy evolves. Fed policy might need to as well.
2% has become such widely accepted orthodoxy that making this break will not be easy. The first step to opening up the topic for consideration may involve more attention by those with accepted economic credentials to the arbitrary, unproven nature of the number to begin with and then asking those who want to tie themselves to that number to justify why.
What would be a more reasonable number? I have heard economists I respect suggest 2.5 - 3.0% as a more reasonable range. That is a range I have long felt would still be perfectly appropriate. However, rather than picking a different arbitrary number, a little research and data analysis might be instructive rather than just pulling a number out of the air like New Zealand did 50 years ago. We are still living with the ramifications of that one poorly considered offhand remark.
Thanks for this summary! I will need to think about how I take this into consideration for retirement withdrawals.
You understand this so much more than I do, but I wonder if at least *aiming* for 2% inflation is part of what has generally kept it around 3% in modern times. Basically they’re aiming for a pretty low rate, and they sometimes miss it, and the result is never too much worse than 3%.
So in this very unsophisticated hypothesis, if they aim for 2.5 to 3%, then maybe we end up with 3.5% or 4%?