
The Inflation Rebound
Fast and Furious

The recent battle against inflation appeared to be going well with the CPI bottoming at 2.4% and core CPI bottoming at 2.5% in January of 2026. That was the lowest core CPI print in almost 5 years going back to early 2021. A that time I wrote about the resilience of the US economy’s ability to hold up in the face of many headwinds.

Two weeks later we had a second consecutive concerning PPI print and I warned that there was another side to disinflation that was likely bubbling underneath the good CPI prints and hiding some latent inflationary forces.

The 3% inflation anchor was still operating and I argued we were likely to see those underlying forces of inflation pull us back towards 3% or perhaps beyond as we entered the second half of 2026.

That 3% inflation anchor is an important concept that I have come back to many times over the past year. The very unusual decade of the 2010s driven by a once in a lifetime financial crisis caused us to become too accustomed to the idea that sub 2% inflation was normal, but it simply is not normal nor is it easily achievable under normal circumstances.

This week we have started to see all these forces play out in front of our very eyes with a sharp increase in inflation numbers. Yesterday we got an April CPI print that was quite hot. Annualized CPI inflation jumped to 3.8% after having jumped to 3.3% the previous month up from 2.4% in February. That is a very sharp and rapid rebound. Core inflation also jumped to 2.8% from 2.6% last month also up from 2.5% in February.
We can see how energy driven this is with the CPI rising so much faster than the core, but even the core which is isolated from energy has seen a meaningful 0.3% increase in 2 months. If we look at some of the details under the numbers we can see that the inflation is not merely isolated to energy. That inflation anchor was already pulling us back toward 3% prior to the Iran War’s impact on energy prices.
Shelter costs which had been declining so reliably jumped back up 0.6%. Many other categories also saw increases. In addition wages actually fell, and for the first time in 3 years annual wage increases are now below annual inflation increases.
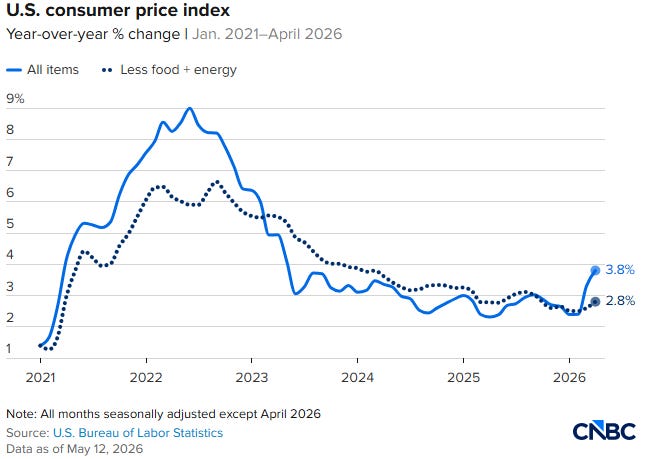
The moves on this chart are concerning because the only time in the past 5 years we have seen anything this steep was during the start of the COVID inflation burst when we heard the word transitory bandied about to a level that the Fed now wishes it could erase from its past. They are likely going to be more careful about that word this time, but there is already talk of looking through this inflation as primarily a short term energy driven disruption. Caution may be advised in the messaging here as transitory by any name is still transitory.
Now what could not be known in February was that the US would go to war with Iran, closing the straight of Hormuz, and causing a global oil and energy disruption that is unparalleled in world history. The closest comparison would be the 1973 Arab oil embargo which was a driving force in the largest and longest period of US inflation in modern history. The 1973 oil embargo only lasted for 6 months but it quadrupled the price of oil and led to severe economic and supply disruptions that lasted throughout the rest of the decade.
The current Iran war has only lasted for 2.5 months thus far, but it has already nearly doubled the price of oil. Every promise of a resolution seems to evaporate almost as quickly as it is suggested. Enough damage has been done to energy infrastructure and supply chains that even a near term resolution will have lasting ramifications.
Then today we got an even hotter April PPI print with PPI showing a 1.4% monthly increase jumping all the way up to 6.0% annually vs 4.9% expected and up from 4.3% in March. These are shockingly large increases. Energy was a meaningful component but tariff pricing pass throughs were another meaningful factor.
Core PPI jumped to 5.2% annually vs 4.3% expected and up from 4.0% in March. These are broad increases across the wholesale supply chain. Some of this will lead to further CPI increases in the coming months.
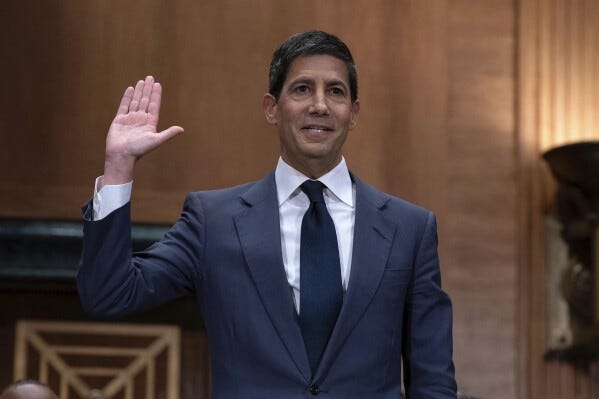
The timing of these inflation reports could not come at a worse time for newly confirmed Fed Chair Kevin Warsh who just received Senate approval of his chairmanship today.
He and the President have been clamoring for lower rates for over a year. While the Fed has lowered rates some, Warsh and the President have argued rates should come down considerably more than they have. Meanwhile the market driven bond rates that most lending is based on are actually flat to up during the entire time frame that the Fed has modestly lowered rates. The President has yet to understand that you cannot force rates to where you want them in a true market economy.
Last month the Fed and current Chairman Jerome Powell sent a clear message that they would not go along with strong arm tactics to manipulate interest rates to appease either the President or the new Chair.

The Fed dissenters were arguing that they felt the Fed posture should be more balanced with no bias towards a future easing. Yesterday’s CPI report caused market participants to project a nearly 40% chance of a rate hike by the end of 2026.
The Fed once again looks to be ahead of the curve and seeing things far more clearly than their detractors. There is no longer a reasonable argument for rate cuts unless we face a meaningful economic contraction. Inflation is simply running too high now, and it doesn’t look like it will be getting better anytime soon.
Unfortunately, unlike the previous inflation which was primarily a COVID supply chain driven event, this one is entirely self inflicted. It started with nascent tariff pricing pressures and is now being drastically exacerbated by an unprovoked US invasion of Iran that will continue to have very meaningful world-wide pricing and supply ramifications for years to come.
By year end we may very well be hoping that 3% inflation anchor can work its magic to pull inflation back down towards the 3% equilibrium.